Everything related to the Aeroyantra cloud platform, browser tools, and commercial plans.
Explore specialized workflows for mining, construction, infrastructure, energy, and enterprise sectors.
Browse service lines by output type, project environment, and delivery requirement.
Read the material that supports evaluation, project planning, and field execution.
Precision Agriculture Surveys to See Every Problem Zone Before It Costs You a Harvest
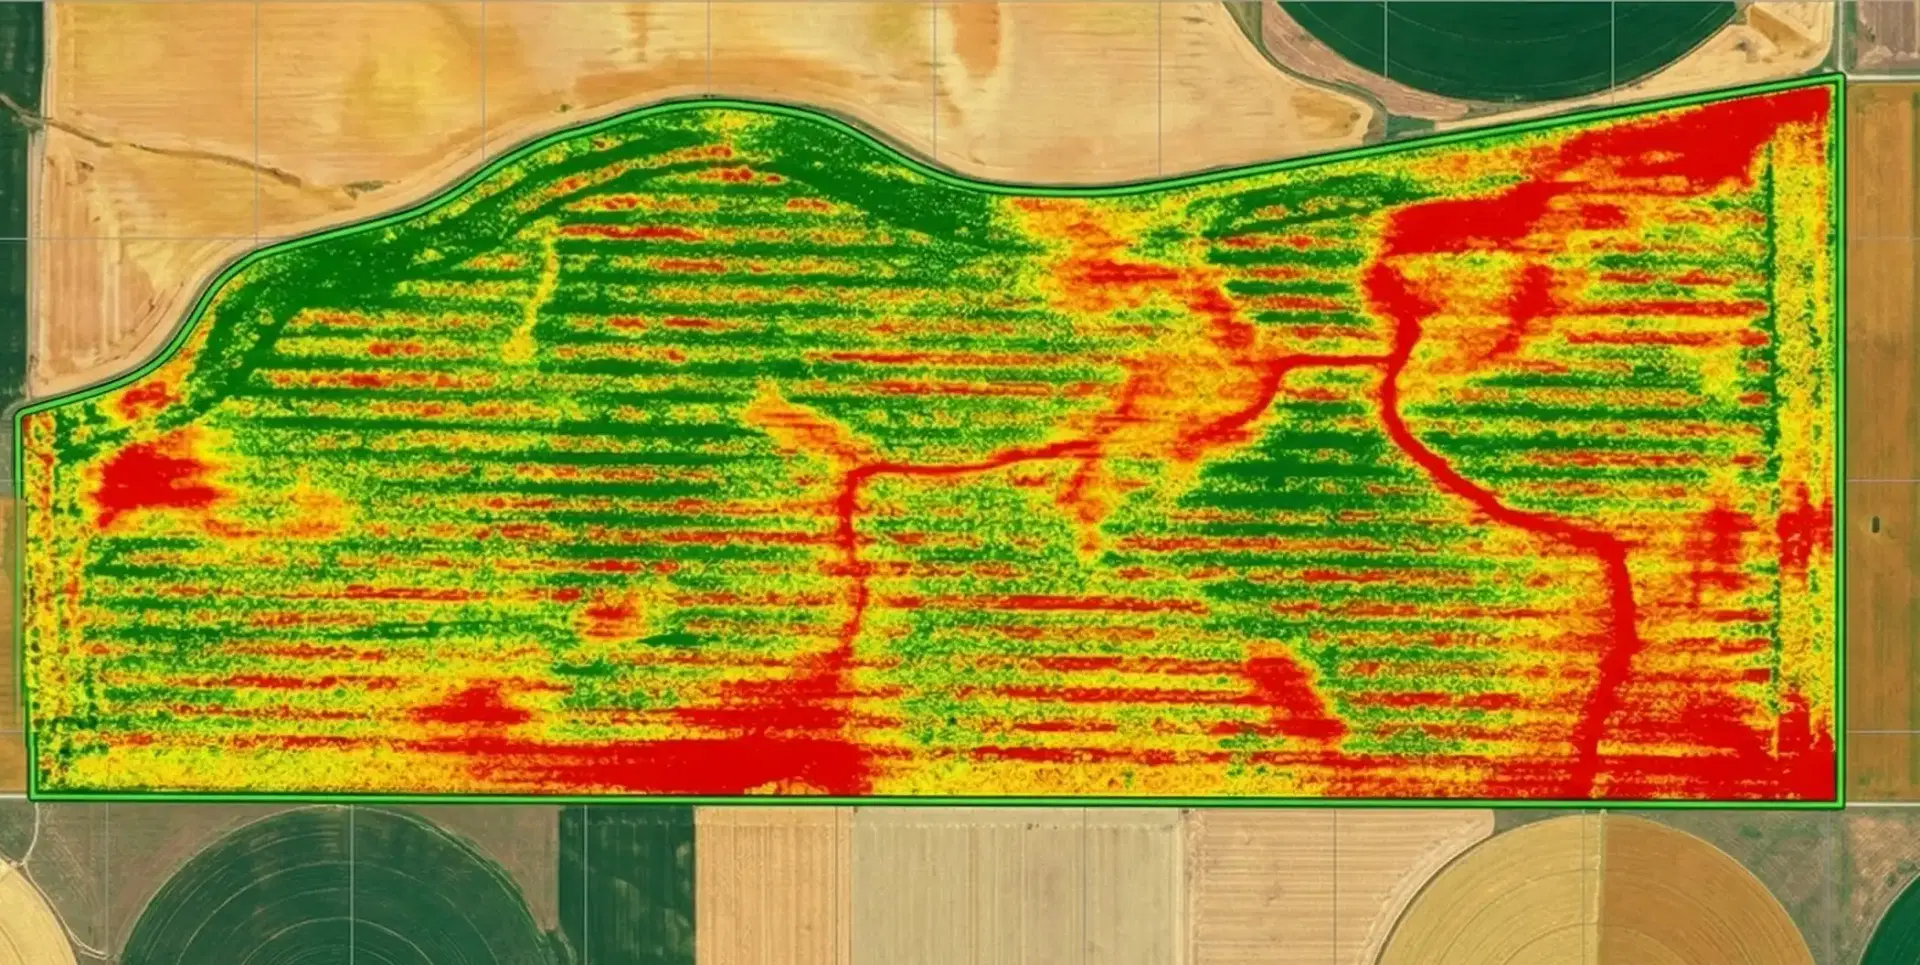
Crop stress, nutrient deficiency, and pest pressure spread silently until they are visible to the naked eye and by then, yield loss is already locked in. PMFBY insurance claims without georeferenced damage evidence get disputed. Our DGCA-certified teams deliver multispectral NDVI crop health maps, automatic stand counts, PMFBY-ready damage reports, and variable rate prescription maps for wheat, paddy, cotton, sugarcane, soybean, and maize within 24-48 hours of survey completion.
Precision Agriculture Survey Package
Structured for growers, agronomists, and farm managers who need actionable field data.
Multispectral Crop Health Analysis
NDVI and NDRE mapping to detect stress, nutrient deficiency, and disease before visible symptoms appear.
Automatic Stand Counting
AI-powered plant detection across the entire field for population density and gap identification.
Variable Rate Prescription Maps
Zone-based fertilizer and pesticide application maps compatible with major precision ag platforms.
Rapid Damage Assessment
Post-storm georeferenced damage mapping with severity classification for insurance claims.
What You Receive
India Agriculture Support
Specialized services for Indian crops, growing seasons, and PMFBY insurance requirements.
PMFBY Crop Insurance Documentation
Georeferenced damage reports formatted for Pradhan Mantri Fasal Bima Yojana claims and state government compensation applications. Pre-event baseline surveys compared against post-event damage surveys provide defensible documentation for disputed claims.
Kharif and Rabi Season Coverage
Survey workflows optimized for major Indian crops across both growing seasons - wheat, rice/paddy, cotton, sugarcane, soybean, maize, groundnut, and vegetables. Crop-specific analysis for disease detection, pest monitoring, and yield estimation.
Indian Crop Disease Detection with Agricultural Drone Mapping
Specialized multispectral analysis using drone mapping services and aerial survey drone for common Indian crop diseases - wheat rust, rice blast, cotton bollworm, sugarcane smut, fall armyworm in maize, and early leaf spot in groundnut. Early detection before visible symptoms appear.
State Government Reporting
Survey documentation structured for state agricultural department requirements including crop damage assessment, area verification, and yield estimation reports for government compensation schemes.
Drone Agriculture Mapping Outputs: NDVI and Crop Health
Every Aeroyantra agriculture survey is delivered as field maps your agronomist can act on: NDVI and NDRE crop health layers over the field orthomosaic, field boundaries, stress-zone areas and a Plant Index reading at any point, all on one platform link.
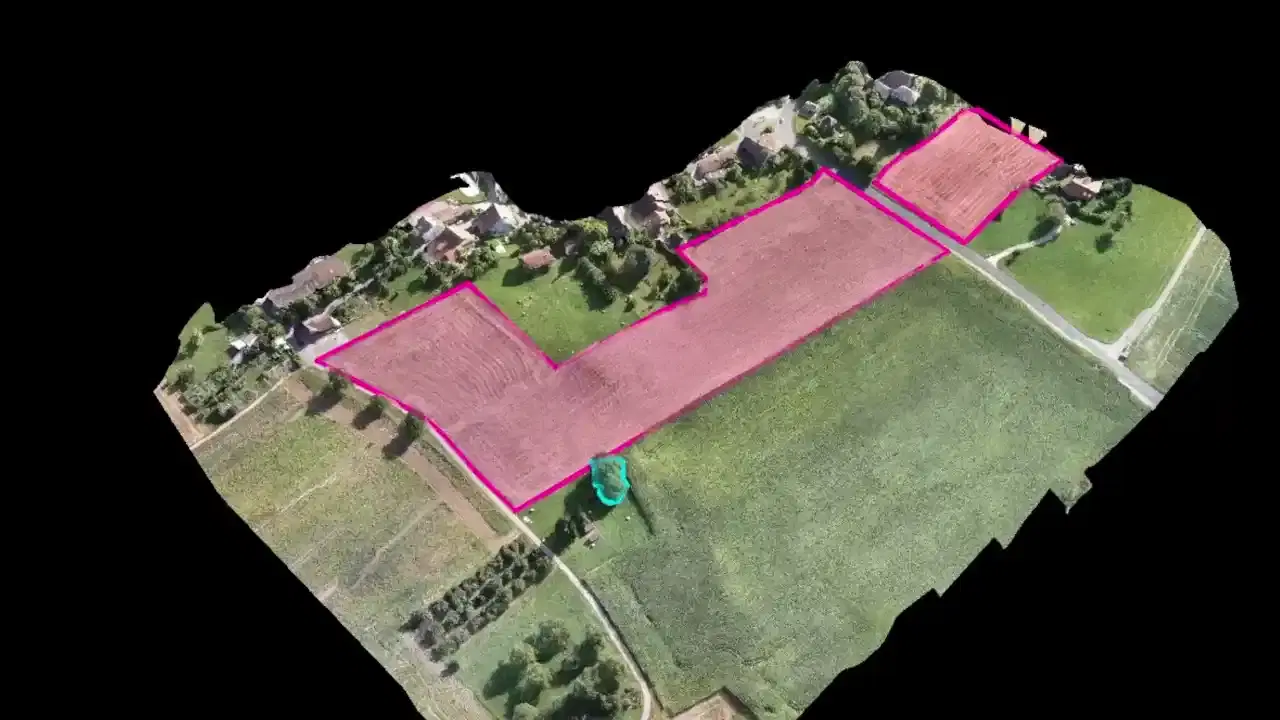
Process your own multispectral data with drone agriculture mapping software, check supported multispectral drones, or see how an aerial survey runs.
What We Survey
Use-case coverage across crop health, stand analysis, and precision application.
Crop Health Monitoring with Drone Agriculture Mapping
Full-field NDVI and NDRE mapping using drone survey mapping and aerial drone survey to identify stress zones, nutrient deficiencies, and disease at early onset.
Stand Count & Population Analysis
Automatic plant counting across the entire field for replanting decisions and trial plot comparisons.
Variable Rate Application
Prescription maps for targeted fertilizer, pesticide, and irrigation application based on field variability.
Crop Damage Assessment
Rapid post-event damage mapping for insurance claims with georeferenced severity classification.
Trial Plot Analytics with Agricultural Drone Mapping
Precise plot-level NDVI, stand count, and biomass data using agricultural drone mapping for seed trials and product evaluations.
Irrigation and Drainage Stress Mapping via Aerial Survey
Identify waterlogging, uneven irrigation, and low-performing wet zones through aerial drone survey before they reduce stand health or yield.
What an Agriculture Survey Visit Looks Like
Pre-Survey Planning
Field boundary confirmation, survey objective discussion, and flight planning based on crop type and growth stage.
On-Site Drone Agriculture Mapping
Multispectral or RGB drone agriculture mapping deployment with RTK georeferencing for accurate field aerial mapping.
Cloud Processing
Automated processing for orthomosaics, NDVI maps, stand counts, and prescription map generation.
Delivery and Support
Platform access to all deliverables with agronomic interpretation support and prescription map export.
Season-Long Monitoring Package
Fixed annual engagement for multi-stage crop monitoring from emergence to pre-harvest.
LiDAR Survey for Plantation and Orchard Analytics
For plantation crops, orchards, and agroforestry sites where canopy density limits standard aerial imaging, our drone-based LiDAR captures detailed canopy structure and ground terrain simultaneously — used by agri-enterprises and FPOs across India for mango, coconut, rubber, oil palm, and timber plantation management.
Frequently Asked Questions
Common questions about agriculture drone surveys
NDVI measures overall vegetation density and health using near-infrared and red bands, effective for detecting stress and sparse canopy. NDRE uses the red edge band to detect chlorophyll content within dense canopies where NDVI saturates. NDRE is more sensitive to early-stage nitrogen deficiency in crops at full canopy closure - making it preferred for late-season nitrogen management in wheat, rice, and sugarcane.
Aeroyantra's automatic stand counts achieve 95% or better accuracy for most row crops at early emergence stages. Accuracy depends on image resolution, crop growth stage, and lighting conditions. Drone stand counts are significantly more accurate than manual transect counting because they cover the entire field rather than sampled areas.
Yes, Aeroyantra generates prescription maps compatible with John Deere Operations Center, Trimble Ag Software, and standard ISOBUS-compatible variable rate controllers. Maps are exported as georeferenced shapefiles or platform-specific formats. We recommend confirming your equipment's format requirements before the first application.
For standard multispectral surveys at 5-10cm resolution, a single flight covers 50-150 acres depending on altitude and conditions. A typical 500-acre farm can be fully surveyed in 3-5 flight cycles in a single day. For larger operations, multi-drone deployments are available.
Aeroyantra delivers NDVI maps, stand count results, and damage assessment reports within 24-48 hours of flight completion. For urgent post-event damage assessments, priority processing is available. All maps are accessible through our browser-based platform from any device.
Yes, Aeroyantra provides georeferenced, time-stamped crop damage reports formatted for Pradhan Mantri Fasal Bima Yojana (PMFBY) claims and state government compensation applications. Pre-event baseline surveys compared against post-event damage surveys provide the most defensible documentation for disputed claims.
Absolutely. Aeroyantra has specialized workflows for major Indian crops including wheat, rice/paddy, cotton, sugarcane, soybean, maize, groundnut, and vegetables. Our analysis includes crop-specific disease detection like wheat rust, rice blast, cotton bollworm, and sugarcane smut across both growing seasons.
Yes, Aeroyantra's survey documentation is structured for state agricultural department requirements including crop damage assessment, area verification, and yield estimation reports for government compensation schemes and agricultural monitoring programs.